
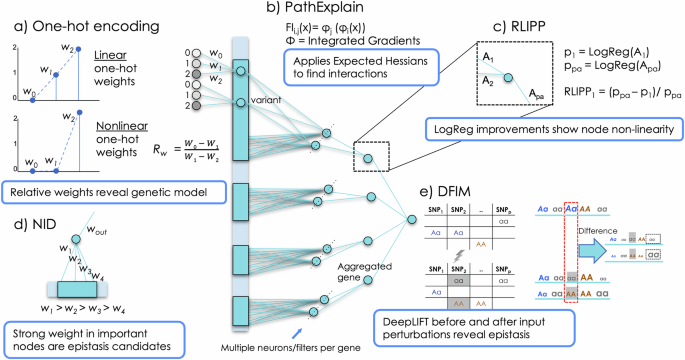
To showcase the potential of our approaches in real-life data, we applied the methods to the IBD dataset with 66 280 observations and 38 825 SNPs after preprocessing. We divided the data into train (65%), validation (20%) and test (15%). As in Ellinghaus et al.33, we used the first 7 principal components to model population stratification.
Neural networks were created using GenNet command line functionality and both positional and functional annotations. As a result, a SNP can be linked to multiple genes. The covariates are inputs to the last hidden layer, before the final prediction. We built neural networks with and without one-hot encoding and achieved good predictive performance, with an AUC of 0.745 (0.715, for the one hot) in the validation set and 0.793 (0.761) in the test set. After training, we apply the epistasis detection methods on the trained models to extract the learned nonlinearities. We do this in a two-stage approach to improve the statistical power to detect epistasis. First, we reduce the search space by selecting only the most promising variant pairs. We evaluate the top 100 pairs of variants identified by that method. In the second stage, we test the significance of the interaction using logistic regression with an interaction term, using the validation and test set.
Interaction detection in visible neural networks
RLIPP provides insight into which parts of the network the largest non-linearities can be found. We found that the node representing the gene CCL11 had the highest relative improvement (see Supplementary Fig. 11). LYPLAL1-DT and SNX2P1 had the highest RLIPP values for the neural network trained with the one-hot embedding (see Supplementary Fig. 12).
NID, DFIM, and PathExplain
The top epistasic pair (hit) of NID, for both the network built with and without the one hot encoding, was rs2066844–rs2066845, both missense variants in the NOD2 gene and leading causal variants of Crohn’s disease and IBD in both DisGeNet and SNPedia databases ( and PathExplain, on the neural network with the one hot layer, had the SNP rs2066844 (NOD2) as part of the top epistasic pair together with rs5743293 (NOD2), a frameshift variant, related to both Crohn’s disease (vda score = 0.83) and IBD (vda score 0.02). rs5743293 is particularly important for PathExplain one hot, as it is a hub involved in all the top-100 interactions. DFIM (on the network with one hot), showed the same behaviour, having a SNP, rs12946510, involved in 99 out of the top 100 interactions. rs12946510 (IKZF3, GRB7) is an intergenic variant associated to Crohn’s disease, IBD and Ulcerative colitis, as per the GWAS catalog. DFIM’s, on the one-hot neural network, top epistasic pairs involve rs12946510 (IKZF3, GRB7) with rs2066844 and rs2066845, both previously described. A list of the top SNP-SNP interactions for NID can be found in Supplementary Table 3 for the network with the one hot encoding layer and in Supplementary Table 4 for the network without the one-hot layer.
The top interaction in DFIM, in the network without the one-hot encoding, was between rs80174646 (intron variant, IL23R) and rs11805303 (intron variant, C1orf141/IL23R); both previously reported in association with Crohn’s disease and IBD. (GWAS catalog). The second strongest interaction was between rs9988642 (IL23R) and rs11403745 (intergenic, LINC014675). The former is a downstream gene variant, mapped to the IL23R gene, a protein-coding gene associated with Inflammatory Bowel Disease. rs11403745 is an intergenic variants whose closest gene is LINC01475, a non-coding gene. Nearby is also SEC31B, which has been associated to IBD. rs11403745 (intergenic, LINC014675) is also the SNP most present, 24 times, in the DFIM’s top 100 interactions. The same variant (rs11403745) is also part of the second top association in NID (on the network trained with the one-hot layer), together with rs5743293 (NOD2), the hub SNP in PathExplain. Interestingly, a recent study highlighted rs11403745 in relation to IBD43. rs9988642 (IL23R) and rs80174646 (intron variant, IL23R), part of the top and second interaction in DFIM (without one hot encoding layer), are also the second-highest interaction of NID without one hot encoding.
PathExplain on the network with the one-hot encoding detected the strongest interaction between rs9296009 (intergenic, closest are PRRT1, FKBPL) and rs2413583 (intergenic, RPL3, PDGFB). While the former has not been reported in the literature, rs2413583 has been associated with Crohn’s disease, IBD, and ulcerative colitis, according to the GWAS catalog. Moreover, rs5743293 (NOD2) is the SNP most present, 26 times, in the top 100 interaction; it was part of all top 100 interactions of PathExplain with one hot layer and in the second position using NID on the network with the one-hot layer.
LGBM
There was no straightforward way to incorporate confounders into LGBM. Hence, we first regressed the phenotype with the 7 PCs with a linear model, subsequently using LGBM with the residuals as the outcome. LGBM provides both the feature importance and the interaction importance rankings for SNPs. Supplementary Tables 5 and 6 show the top-10 hits and the complete ranking can be found in Supplementary Table 5. Moreover, the most important feature according to feature importance, rs2066844 (NOD2), is known to be the leading causal variant of Crohn’s disease. The top 3 features per LGBM’s feature importance, rs2066844, rs5743293, and rs2066845, are all linked to gene NOD2 and all associated with both IBD and Crohn’s disease. Remarkably, out of the top-10 hits, 9 of them were already known in the literature to be associated with both Crohn’s and IBD. The only hit not present in DisGeNet, rs11403745 (intergenic, LINC014675) has been recently associated to IBD and has been extensively discussed in the previous subsection.
For the LGBM’s interactions score, the top two SNP-SNP pairs involved rs5743293 (NOD2), first with rs80174646 (IL23R); and then with rs2066844 (NOD2). All three SNPs are known in the literature and have been found and described by the various neural network interpretation methods above. Overall, out of the top-10 SNP-SNP interactions, all but one SNPs are present in DisGeNet, for either IBD or Crohn’s disease. The majority of them are mapped to either IL23R or NOD2. The single SNP that is not present in DisGeNet is rs11403745 (intergenic, LINC014675).
Rank aggregation and shared variants
Overall, we investigated the accordance and the peculiarities of each method on the IBD data for a broader picture of the agreement and disagreement of each interpretation method. We only calculated the interactions for the hundred most predictive variants for the DFIM and Pathfinder, restricting the search space, to reduce the computational burden.
First, we ranked every variant from NID, DFIM, PathExplain, both with and without one hot encoding layer, and LGBM, resulting in eight different rankings. For each method, the variant’s score is calculated as the sum of the interaction score (i.e., NID score, DFIM score, LGBM score,.) of every pair containing the variant. A comparative study from Li et al.,44 guides us toward using the geometric mean of the rankings. In this analysis, variants not present in a particular method, i.e., outside of the top-100 for DFIM and PathExplain, were assigned the lowest rank plus one. The geometric mean of the ranking of the eight methods highlights rs2066844, rs2066845, and rs5743293 (all NOD2 variants), as the top hits. Such variants were consistently present as top variants in each different method, with rs2066844 and rs2066845 ranked top-10 in 6/8 methods, with the only exceptions being 1) DFIM built without one hot layer and 2) the NID with the one hot layer.
Of the top-10 ranked hits, nine are already linked to either Crohn’s disease (9) or IBD (7) in DisGeNet. The other hit is rs11403745, recently related to IBD43. Another relevant SNP, in the top-100 in 7 out of 8 methods is rs9271588, a variant in the HLA region, that has been extensively studied in autoimmune disease and particularly Sjögren’s disease45,46. The full ranked table is available in the Supplementary Materials.
Furthermore, we plotted for each method the top 100 variants, the most promising candidates for epistasic effects, in an UpSet plot (Fig. 4a). To immediately visualize the adherence of our hits with the literature, we also included the list of SNPs associated with Crohn’s and IBD present in DisGeNet that are part of our 38,825 pool of input SNPs, respectively 314 and 228.

Each standing bar shows the number of overlapping pairs between the highlighted method(s). In (a) For each approach, the top-100 SNPs with the highest importance score were evaluated. The horizontal bar represents the number of SNPs included in each analysis, whereas the vertical bars show the overlap between each analysis; In (b) the top-100 SNPs were mapped to gene positionally (as explained in the method section), and the intersection is showed. Finally, in (c) the shared genes between at least one approach and one DisGeNet list are highlighted.
From this UpSet plot it can be seen that the top-100 hits combining all methods have a high overlap with the known hits in DisGeNet. LGBM’s feature importance (LGBM 1d) and epistasis detection (LGBM 2d) had the biggest overlap with > 40 out of the top-100 hits present in the DisGeNet hits for both Crohn’s disease and IBD, respectively 62 and 55 for Crohn’s and 52 and 45 for IBD. NID methods have around 20 hits, with, for NID with the regular embedding and the one-hot embedding, respectively 23 and 24 in Crohn’s disease and 17 and 21 in IBD. DFIM and Pathfinder have similar results, with the lowest number of hits belonging to DFIM without the one-hot embedding on the IBD list, with only 12 hits.
Out of the considered methods, DFIM and PathExplain on the one-hot encoded network were the ones with the most unique hits, with DFIM having almost half of the variants in the top-100 not being in the top-100 of any other method or a known SNP from DisGeNet. On the other side of the spectrum, PathExplain and LGBM’s feature importance had the lowest number of unique hits.
Three variants were in the top-100 of all the mentioned methods, respectively rs2836878 (intergenic, RPL23AP12 and LINC02940), rs3024505 (upstream of IL10; close to Y_RNA), and rs10781499 (CARD9), with known association to IBD and Crohn’s disease. The first is an intergenic variant, while the last is synonymous. Interestingly, in the GWAS catalog there are multiple studies linking rs10781499 to IBD disease, Ulcerative colitis and Crohn’s disease. rs2836878 has also been associated with IBD, Ulcerative colitis, and Crohn’s disease, as per the GWAS catalog. Finally, a study on a Danish cohort suggests a link between rs3024505 and the risk of Crohn’s disease47.
By mapping the top-100 SNPs to gene positionally (+/- 10 kb), we saw the overlap between methods and literature’s known hits (Fig. 4b). We found that eight relevant genes for both Crohn’s and IBD (Y_RNA; RPL23AP12; NOD2; LINC02943; IL23R; IL10; CARD9; C1orf141) have at least one SNP mapped to them in each method (Fig. 4c).
Association analysis for candidates pairs
We verified the findings from our previous methods with the most popular framework in epistasis detection, namely a logistic regression (LR). We grouped the top-100 SNP pairs from each of the seven epistasis methods. Hence, we ran a logistic regression to predict the phenotype using each pair of SNPs. The formula is, for a pair of SNPs SNPi and SNPj, as follows:
$$logit(Y)= \, {\beta }_{0}+{\beta }_{1}SN{P}_{i}+{\beta }_{2}SN{P}_{j}+\gamma SN{P}_{i}SN{P}_{j}\\ +{\alpha }_{1}P{C}_{1}+…+{\alpha }_{7}P{C}_{7}+\epsilon $$
Where the PCs are the seven principal components to model population stratification. Hence, the γ coefficient reflects the epistasis interaction between a pair of SNPs. To avoid inflating the results, we ran logistic regression on the validation and test set combined, excluding the training examples that the network has seen. This is a common approach to reduce the multiple testing burden (e.g. refs. 48,49. More formally, Pecanka and Jonker50, showed that if the two stages are independent, then only correcting for the number of tests in the second stage is sufficient.
Repeating the regression estimation for all pairs identified with the epistasis detection methods, we identified 7 significant SNP pairs after Bonferroni correction (Supplementary Table 7); out of those, two would stay significant under the usual GWAS threshold of 5*10−8. These epistasis pairs show different linear and non linear weights proportions (Supplementary Fig. 15), showing a prediction improvement, and with a different weight proportion from the zeroed-out weights of non-significant SNPs (Supplementary Fig. 16); Supplementary Fig. 17 shows the contribution of the interactions to the prediction.
link